
About this article

Dr Alexandre Alimasi Akili is a Scholar of The Geneva Learning Foundation, a clinical doctor, and a public health and field epidemiology expert in the Democratic Republic of the Congo (DRC). He presents a research idea to explore. He is not reporting on work that combines the two frameworks he talks about. He does not have a formal role implementing the 7-1-7 framework and is not currently working in the field in that role. His ideas come from his past work with disease surveillance, alert detection and investigation, and preparing, coordinating, and monitoring epidemic responses at the operational and subnational levels across several DRC provinces. What he describes is a working idea to explore, not a proven model adopted by The Geneva Learning Foundation (TGLF). We publish it because this question, raised from the field, deserves discussion.
See earlier, act faster: a working idea for linking the 7-30 and 7-1-7 frameworks
Between 2018 and 2024, the provinces of Tanganyika and Kasai (DRC) faced overlapping health, environmental, food, and humanitarian challenges. In this context, repeated floods act as major drivers of problems across the system. They damage access to safe drinking water, sanitation, food security, health care, and disease surveillance all at once. This note looks at how these problems connect in a sequence: climate events → damaged infrastructure → people forced to move → changed health risks.
This reflection rejects the simple idea that floods directly cause disease. That relationship is heavily shaped by seasons and population movement. Instead, it asks whether the health system can turn a local warning sign into action. It proposes a new way to connect the 7-30 CHEF approach (a structured action and learning framework built around two timeframes: seven days to prepare and thirty days to recover) and the international 7-1-7 metric (aimed at fast detection, notification, and response to epidemic alerts).
The working idea is that strengthening this local knowledge, promoted by The Geneva Learning Foundation, makes existing systems more sensitive and responsive without creating parallel surveillance structures.
Introduction: Floods, environmental challenges, and health risk patterns in the Democratic Republic of the Congo (2018-2024)
The Democratic Republic of the Congo (DRC) works within a complex health and humanitarian setting, where repeated epidemics, chronic food crises, displaced populations, and increasingly intense climate shocks overlap. Within this fragile system, the provinces of Tanganyika and Kasai show how environmental risks and public health challenges come together.
In these regions, floods do more than cause high water. They amplify risks across the system. They change the basic conditions for health by contaminating water sources, flooding sanitation systems, and destroying essential health care and transport facilities. These problems directly block routine services, especially vaccination campaigns and nutrition monitoring. They also cause overcrowding among displaced populations and change where disease-carrying insects and animals live. The challenge for public health research is not to prove a simple cause-and-effect link between floods and disease. It is to understand exactly how an environmental shock changes the overall vulnerability of a community.
Tanganyika and Kasai provinces offer contrasting and complementary examples. Tanganyika, bordered by the lake of the same name and crossed by major rivers, faces the full effects of extreme flooding and water level changes in a context of high cholera presence. The WHO reports cholera cases throughout the year. The Kasai basin presents specific water-related vulnerability patterns that worsen already critical indicators of malnutrition and disease outbreaks. This combination of acute climate vulnerability and high disease burden requires rethinking how we anticipate and respond. It shows the need for integrated disease surveillance that can link overall operational speed with detailed local context analysis, at the heart of The Geneva Learning Foundation’s teaching approach.
Two frameworks, two logics, two sets of numbers
To follow this reasoning, we first need to understand what these numbers mean, because the two frameworks have different purposes and different origins.
The Climate Health Emergency Framework is a framework developed by TGLF based on stories from health professionals in countries vulnerable to climate change who came together in Teach to Reach, the largest peer learning community of and for people working in health, between July 2023 and July 2026. It breaks down a climate emergency into three phases around two easy-to-remember numbers under pressure. The 7 means seven days to prepare: in the seven days after an alert or seasonal sign, the area confirms it is ready, risks are reviewed, the plan is activated, roles are clear, and trusted partners are mobilized. The 30 means thirty days to recover: in the thirty days after the event starts, essential services are stabilized or adapted, the cost of the event is documented, and action is taken to make the next time less difficult. The response is what happens between the two, and it starts when the situation requires it, not on a fixed date. The framework does not replace clinical guidelines, surveillance, emergency systems, or government plans: it helps use them before, during, and after a service disruption. Free level 1 certification lets people learn it and build a local plan.
The 7-1-7 is a performance target for epidemic response. It is carried forward by the 7-1-7 Alliance, a country-led initiative. It sets three timeframes: seven days at most to detect a suspected event, one day to report it, and seven days to launch an effective response. Its main value is not the score achieved but systematic identification of the bottlenecks that explain delays. The World Health Organization has integrated the 7-1-7 target into its fourteenth general work programme 2025-2028 and into its framework for national alert and response to health emergencies, and it offers “Early Action Reviews” that use the 7-1-7 to assess performance in real time.
The 7-1-7 numbering inspired the approach that led to 7-30. But the two frameworks do not cover the same ground. The 7-1-7 deliberately limits itself, and rightly so, to epidemics. Climate effects on health are not limited to epidemics. The 7-30 brings a cross-cutting perspective that must integrate response alongside other dimensions.
| Dimension | 7-30 CHEF | 7-1-7 |
|---|---|---|
| Purpose | Climate emergencies and their multiple health effects | Epidemics and outbreaks of infectious disease |
| Logic | See / understand / prioritize / act / learn / adapt | Detect / report and investigate / respond |
| Numbers | 7 days to be ready / 30 days to recover | 7 days to detect / 1 day to report / 7 days to respond effectively |
| Main level | Local team and community | National and subnational surveillance system |
| Origin | TGLF, based on stories from Teach to Reach | Resolve to Save Lives, carried forward by the 7-1-7 Alliance, integrated into WHO tools |
| Function | Structure and make local action visible | Measure speed and reveal bottlenecks |
A flood never causes just one problem
My work has taken me through disease tracking, epidemic preparedness and response, nutrition, coordinating health programs, and health systems in places with few resources. Again and again, I have watched environmental and climate events cause many health problems at the same time.
A flood pushes people from their homes, blocks access to health care, spreads waterborne diseases, raises the risk of diseases carried by mosquitoes and other insects, makes malnutrition worse, and shuts down essential services. This experience led me to ask a practical question: how can we turn what local health workers know into action more quickly, while still working within official disease tracking and response systems? This question brought me to the 7-30 framework.
Tanganyika as a warning zone for connected risks
Tanganyika Province has natural features and human conditions that make it a living laboratory, a “warning zone,” for studying how health and environmental risks connect. The province sits beside Lake Tanganyika and has many rivers and streams. This geography means flooding happens again and again along the water. Added to this are serious economic and social challenges. Local communities are often cut off or move frequently across borders and for fishing. They depend on growing food for their families and on ways of making a living that climate affects.
For public health, Tanganyika has a heavy burden. Cholera keeps coming back. People face major barriers getting health care and getting clean water, toilets, and hygiene services (WASH). Studying this province does more than record when floods happen. It lets us watch in real time how everything connects in a fragile system. It shows how one flood can damage critical health services and harm the social structures people depend on at the same time.
Timeline and methods for tracking climate events
Building a history of risks requires careful methods. The data we have now do not let us create a complete timeline of every flood across all parts of Tanganyika from 2018 to 2024. Because of these gaps, this analysis does not guess or create models that would hide what really happened.
To keep the analysis sound, the framework separates:
- Climate events that partner agencies formally recorded.
- Health data from disease tracking systems.
- Ideas about how the environment affects health.
- Time periods where we need to actively collect more data from provincial health divisions (DPS) and central offices of health zones (BCZS).
2018: Early signs of local vulnerability
In March 2018, heavy rainfall and strong winds caused major damage in Manono territory. Many makeshift homes were destroyed. This single event does not prove a long-term climate trend. But it is an important marker. It shows how vulnerable local buildings are. It shows they cannot bounce back from extreme rain.
2020: A major break and cascading impacts
The year 2020 was a turning point for climate shocks in the province. Large floods hit several territories. In March 2020, the International Organization for Migration (IOM) Displacement Tracking Matrix (DTM) recorded massive movements of people after floods in Kabalo territory. At the same time, assessments reported severe destruction in Manono, Moba, and areas around Kalemie. This break in the system shows the chain of events at the heart of our idea. River floods make living conditions worse. This was not an isolated event. The pattern grew stronger the next year. The focus shifted from direct humanitarian impact to a deeper problem. The connection between nutrition and health was breaking down.
2021: Measuring damage and connecting nutrition and health
In 2021, reports from the FEWS NET network gave us the first solid numbers. They showed how badly the Congo River, lakes, and their tributaries hurt people’s lives and livelihoods in Tanganyika. Farming and herding were hit hard. More than 1,147 hectares of crops were completely flooded in Kabalo, Kongolo, and Manono territories. At the same time, 2,367 houses were destroyed across health zones in Kabalo, Kalemie, Kongolo, Manono, and Moba.
These numbers matter for public health research. They show we must include nutrition and economic factors when we look at disease risk. The old way of thinking was too simple. It linked water directly to diseases spread by insects or dirty water. That is not enough. Floods must be understood as part of how humanitarian need and development work together. When crops are flooded, people lose their way of making a living right away. This creates severe food insecurity. Poor nutrition follows, especially in children under five. This makes people more vulnerable to disease.
2022: Careful methods to separate baseline patterns from epidemic peaks
Looking at 2022 requires strict care. We must avoid blaming the wrong place for what happened. At the national level, the World Health Organization (WHO) recorded intense cholera transmission. There were 18,403 suspected cases and 302 deaths. They were spread across 104 health zones in 19 provinces. These national numbers show that conditions across the country allowed cholera to spread widely. But we cannot blame Tanganyika province alone for all of this.
Local data do show a major epidemic surge in Moba health zone during this time. This shows an important principle about disease and the environment. When a disease increases in a place hit by climate shocks, it does not prove one single direct cause. In a place where disease has always been present, researchers must carefully separate what is normal from what is new. Baseline transmission and seasonal patterns must be separated from outside factors. These factors include unusual rainfall, population movements, worse water and sanitation, barriers to getting care, and changes in how well disease tracking works.
2023: Environment, fishing communities, and disease risk come together
The year 2023 shows clearly how health risk gathers in certain places. WHO disease reports showed more cholera cases in Tanganyika during June and July 2023. The cases appeared along the shores of Lake Tanganyika. During this time (June 13 to July 15, 2023), the province reported about 160 suspected cases and 13 deaths each week.
This pattern in space and time makes sense when we look at shared vulnerability. The lake creates conditions where fishing families move often and struggle to get safe drinking water. Because of this, WHO and the Ministry of Health launched a cholera vaccination campaign in December 2023. It reached more than 5 million people across four provinces, including the high-risk Kalemie health zone. This shows that stopping water-related disease requires shifting from treating sick people to preventing illness in specific places.
2024: Extreme floods reshape the conditions that affect health
The year 2024 is the key moment for understanding how climate and health connect in this province. Very heavy rains fell for a long time and caused major flooding. The International Organization for Migration tracked a historic flood of the Moba and Mulobozi rivers. Lake Tanganyika rose to dangerous levels in Moba territory at the same time. This flood started a chain of physical changes. Valley floors flooded. Landslides happened. Riverbanks washed away. Infrastructure was destroyed on a massive scale.
First assessments counted 3,360 homes destroyed and 4,119 families forced to move in with relatives. The floods also covered vital public buildings like ports, schools, and markets. Beyond the physical damage, aid agencies warned right away that disease risk was rising. They worried most about water-related diseases, especially cholera. From a scientific view, this flood does not prove that water alone creates disease outbreaks from nothing. Instead, it shows how one extreme event rapidly changes all the conditions that affect whether disease spreads. It creates the perfect conditions for germs to move through a population.
To understand this sudden change in health conditions from 2018 to 2024, we need a clear way to explain how these pieces connect. The model below treats flooding not as one single cause, but as something that makes many risks worse at the same time.
What the 7-30 changes
What interests me about the 7-30 is that it does not start by trying to gather more data. It helps health workers and local people build skills to watch their surroundings, spot the biggest problems, understand what causes them, use what they have on hand, try solutions, write down what works and what fails, learn fast from what they do, and change their plans for the next round. The field worker is not just someone who sends numbers up the chain. That person also creates useful knowledge. This matters for health systems dealing with messy, shifting crises.
7-30 Climate-Health Emergency Framework: learn, take action, and get certified
The 7-30 CHEF framework, developed by The Geneva Learning Foundation, gives health workers a practical method to prepare, respond, recover, and strengthen their communities before the next climate or health emergency. Through this Level 1 Certification, you will learn to build your local 7-30 CHEF plan with colleagues and earn a certificate to submit to your employer or professional body.
A local observation is not proof
This raises an important question for field epidemiology. Several health workers see more diarrhea cases after a flood. This could be a key warning sign. It could also come from seasonal shifts, better record keeping, changes in how people reach clinics, more people seeking care, new case definitions, observer mistakes, or random chance. We must draw a clear line between local knowledge, early signals, alerts, formal investigation, and proof. The 7-30 could add real value right at that line, not by replacing epidemiology but by giving it better starting information.
Where the 7-1-7 comes in
The 7-1-7 brings a different approach that could work alongside the 7-30. It measures how fast a system can spot an event, report it, start investigating right away, and mount an effective response on time.
My working idea is this: the 7-30 could give local teams a way to think and act that makes existing systems faster to respond, while the 7-1-7 gives us a way to measure that speed. I am not saying this link is already proven or formal. I see it as a working idea that research and action could test.
A proposed model: the risk-multiplier cascade
To connect these approaches, we propose a model that treats flooding not as one isolated cause but as something that makes many risks worse at once. The diagram and table below show the pathways we suggest:
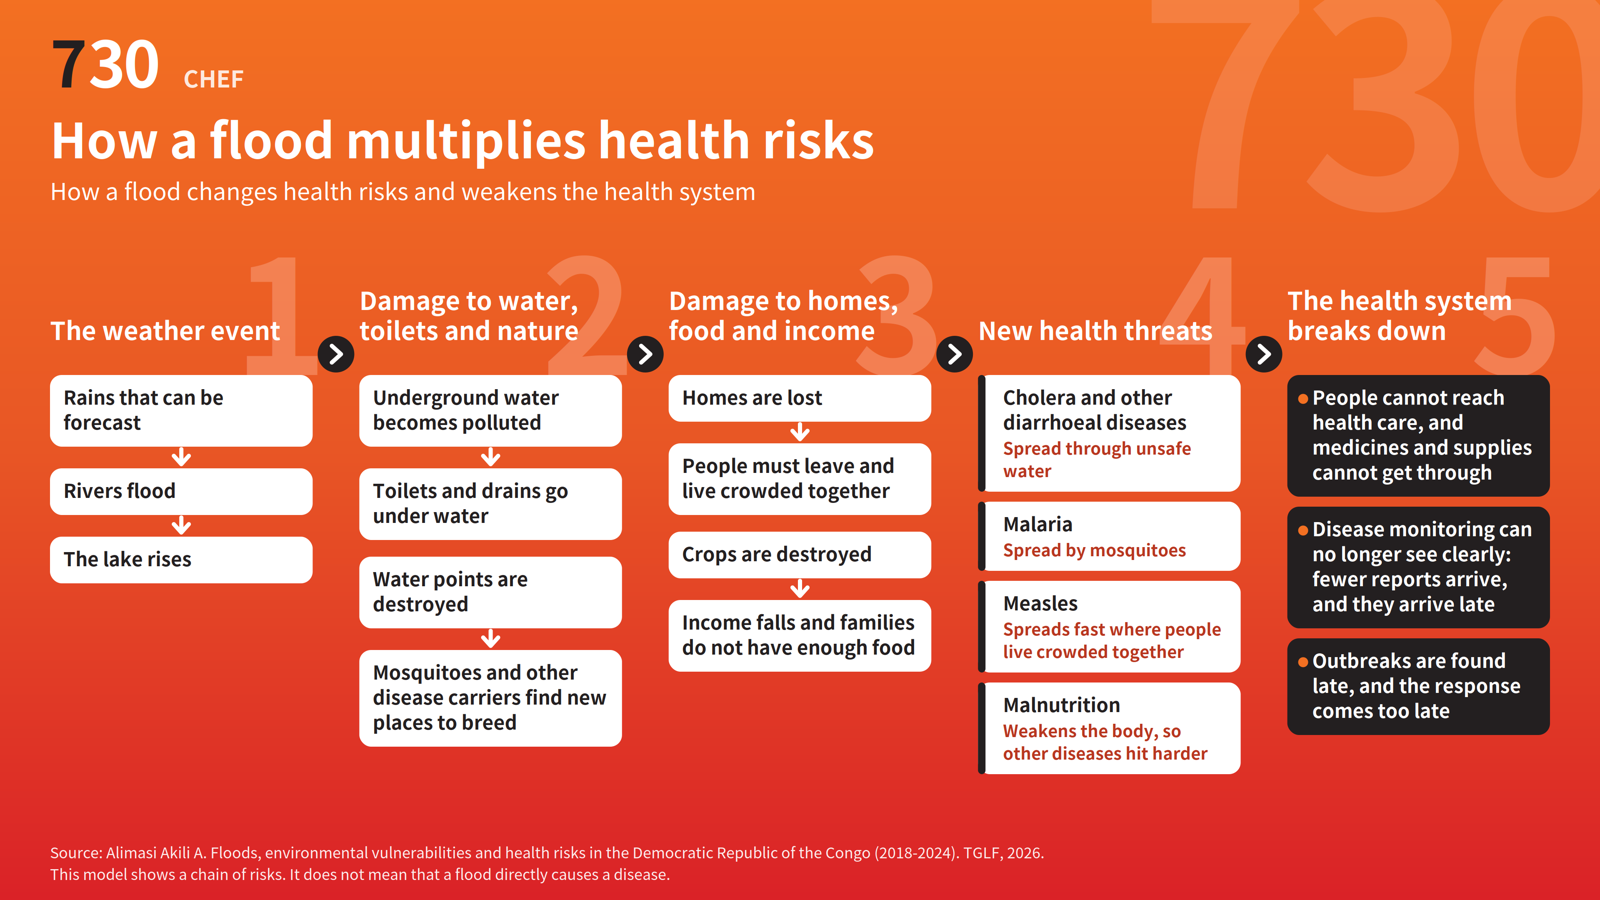
Source: Alimasi Akili A., 2026. Model proposed as a working hypothesis.
| Dimension | Proposed mechanisms |
|---|---|
| Extreme weather event | Heavy rain / river floods / lake level rise |
| Environmental disruptions | Groundwater contamination / sewage system overflow / water point destruction / changes to mosquito habitats |
| Socio-economic disruptions | Loss of homes / forced displacement / overcrowding / crop loss / income drop / food insecurity |
| Health risks | Cholera and diarrheal illness / malaria / measles / malnutrition |
| Health system disruptions | Barriers to care and supplies / weaker surveillance reporting / slow detection and response |
These pathways can happen at the same time and affect each other. This model does not prove one single chain of cause and effect.
Specific analyses by disease
Cholera: Why we need proof from five sources, not just one
Cholera is the best example for studying how health and environment interact when the disease is always present. In a province like Tanganyika, where Vibrio cholerae bacteria circulate all year, flooding makes the problem worse fast. It destroys toilets and water systems. It mixes drinking water with dirty surface water. It forces people into crowded camps. It shuts down health clinics.
But seeing more cholera cases after a flood does not prove the flood caused them. Good analysis today requires five pieces of evidence that all point the same way: the extreme weather event, a measured change in the environment, a change in how people behave or move, a signal from field reports, and lab confirmation (culture or PCR test). When all five line up, how fast the surveillance system responds becomes the main factor that determines whether people live or die.
Malaria: The risk comes later, not right away
The link between floods and malaria is not simple or immediate. Heavy rain and fast floods can wash away mosquito breeding sites at first. This flushing effect destroys larvae and cuts the number of mosquitoes for a short time. The real danger shows up later. After the water goes down, it leaves behind many small pools of standing water in the sun. These pools are perfect places for mosquitoes to breed.
Measuring this risk requires looking at several things together: total rainfall, temperature patterns, the gap in time between the flood and the disease spike, how many people still have bed nets (often lost when they flee), and whether people can still get malaria medicine (ACTs). We need local data with maps and time tracking before we can say flooding causes malaria outbreaks in a specific place.
Measles: Broken vaccination systems and too many people packed together
For measles, flooding causes harm mostly through indirect effects on the health system. The virus spreads only between people and spreads very easily. It takes advantage of the problems flooding creates. First, flooding disrupts prevention. It breaks the cold chain that keeps vaccines safe. It stops vaccination teams from reaching remote areas. It blocks the supply of vaccines and equipment.
Second, flooding forces people to move. Families with different vaccination histories crowd together in host homes or temporary camps. When vaccination services break down and unvaccinated children pile up in tight spaces, conditions are perfect for fast-spreading outbreaks. This is especially dangerous in health zones where measles vaccination rates (VAR1) were already low.
Malnutrition: delayed harm and broken food systems
Acute malnutrition is the slowest result of flooding, but it can be the deadliest. When floods cover farmland, they destroy the crops growing in the fields. They wipe out seed stores. They cut rural family income. They push up prices of basic food in local markets.
The harm takes time to appear. When people eat less food and less variety, their weight and arm size (MUAC) do not drop for several weeks or months after the water goes down. Nutrition tracking must be built into the same early warning system as disease tracking. To understand this risk, health systems need to watch a full set of signs: health outcomes (how many people are admitted for severe or moderate malnutrition, shortages of therapeutic food), and early signals (food price changes, maps of flooded farmland, broken roads to nutrition centers).
Food insecurity and nutrition breakdown hit hardest when communities are forced to move. Forced displacement is the bridge that turns an environmental shock into an acute humanitarian crisis.
Population displacement as the key driver of vulnerability
Past experience in Tanganyika Province shows that flooding drives internal migration. In 2024, IOM reports confirmed that these movements happen over and over, and that displaced people make standard response strategies fail. When people are forced to leave, they lose their farms, their homes, and their usual social and health networks. They face extreme hardship. This sudden displacement overwhelms reception sites in areas the flood did not hit and weakens local ability to treat patients and respond to disease outbreaks.
When environment, migration, and disease are tangled together this way, standard passive surveillance tools reach their limit. To measure and predict these system-wide risks, we need a method that can check both the overall speed of the response and the ability of frontline workers to keep working under stress. This is why the 7-1-7 and 7-30 frameworks are used together.
Data collection, integration, and triangulation protocol
The proposed method combines routine disease tracking data with reports from multiple humanitarian sectors.
Data sources and extraction
Data come from the following official platforms:
- Disease tracking and performance data: Taken from WHO weekly situation reports (Democratic Republic of Congo) and from DHIS2, the national system run by the Ministry of Public Health. These reports track cholera, malaria, and measles cases, how many people die from each disease, and whether health workers report on time and completely.
- Humanitarian impact data: Taken from OCHA rapid assessment reports, FEWS NET updates on food security and crop losses, and IOM DTM flash alerts.
- Environmental data: Taken from rainfall and river measurements recorded by technical services (METTELSAT, Régie des Voies Fluviales).
Triangulation and timeline analysis
To confirm that flooding increases risk without jumping to conclusions about cause and effect, we use a method that compares data across time and space. For each recorded flood event (peaks in 2020, 2021, and 2024), we analyze disease patterns both immediately and after delays. Some diseases appear 2 to 4 weeks later (malaria and measles spread this way), while nutrition problems take several months to show up. The CHEF 7-30 framework checks how well local health structures adapt and learn. The 7-1-7 framework checks where logistics slow down during alerts (detection, notification, and response).
Operational matrix for integrated surveillance
To make this approach work in practice, we propose a single matrix that tracks a signal from the moment people first notice it to the moment the health system learns from it. The framework has nine steps in order. Observation identifies unusual patterns in communities or the environment by counting all signals. Documentation measures how clear these alerts are by checking how many local actors formally record them. Triangulation compares data by checking whether SIMR, event-based surveillance (EBS), and environmental or WASH indicators agree. Detection marks when the health system officially recognizes the threat, measured by how fast it responds. Notification and Investigation confirm that rapid response teams received the signal and verified it through lab tests or field checks. Response is the early action across multiple sectors. Learning and Adaptation close the loop by counting how many changes were made and whether improvements last inside the health zone.
A risk-based approach: the principle of proportionate precaution
One important lesson from this work is that taking action now and waiting for proof do not have to conflict. In some situations, a careful preventive step can be taken while verification continues. For example, after a flood damages a water source in an area where cholera is known to occur, WASH teams can strengthen water safety measures right away without declaring an epidemic. This respects two basic principles: a signal is not proof, but lack of immediate proof does not mean there is no risk.
Integrating environmental variables and building area-based risk profiles
Health surveillance must include environmental data as a standard part of the system. For Tanganyika Province, building strong predictive models means combining multiple data points: total rainfall, lake water levels and river flow, maps of flooded areas and erosion zones, and patterns of population movement and damage to farming, livestock, or health facilities. Moving from purely reactive surveillance to proactive work means using these data points to create area-based risk profiles. This tool lets health zones move beyond standard case-counting, which often misses upstream structural vulnerabilities, to a live map of which areas are most at risk.
Table of composite indicators for area-based risk profile
| Dimension | Target operational indicator |
|---|---|
| Climate hazard | How often, how regularly, and how intensely rainfall and flood anomalies occur |
| Exposure | Population density living in flood-prone areas |
| WASH | Access rate to routine safe water and prevalence of open defecation |
| Epidemiology | Historical incidence rate of cholera, malaria, measles, and diarrheal diseases |
| Nutrition | Monthly admission rate for severe acute malnutrition (SAM) and global acute malnutrition (GAM) |
| Vaccination | Vaccination coverage rate for measles schedule (MCV1 / MCV2) |
| Mobility | Internal migration flows and volumes of internally displaced populations (IDPs) |
| Access | Distance and physical accessibility of health facilities during floods |
| Surveillance | Completeness and timeliness rate for reporting diseases with epidemic potential |
| Response | Availability of emergency supplies and ability to deploy local teams |
| Vulnerability | Composite index combining structural WASH, nutrition, and economic factors |
| Priority | Graded operational risk level to support strategic decisions |
Why the analysis focuses on two areas: Tanganyika and Kasaï
Keeping the analysis centered on both Tanganyika and Kasaï is essential for solid eco-epidemiological comparison. Tanganyika is the ideal setting to study risks from large lakes and cross-border movement, while Kasaï offers a crucial contrast. The goal of comparing them is not to assume all risks are the same everywhere, but to find patterns that hold across systems while understanding what is unique to each place. This comparative approach tests how well surveillance works across two very different crises: on one side, an acute water-related emergency on top of existing bacterial disease (Tanganyika); on the other, chronic nutrition and disease vulnerability made worse by supply chain breaks and population displacement (Kasaï).
Limitations of this analysis
The timeline presented focuses mainly on Tanganyika. A full comparison with Kasaï still needs to be done. This analysis has several limits in its data and methods that affect what we can conclude. First, the data from 2018 to 2024 has gaps and uneven coverage, so we cannot build a complete timeline. Second, the data uses different scales. Sometimes it covers a whole province, sometimes a smaller district, and sometimes just one health zone. This makes some of our analysis less detailed than we would like. Third, there is often a time gap between when we document an environmental shock and when health data becomes available. This makes it hard to measure long-term health impacts precisely. Finally, just because two things happen at the same time does not prove one caused the other. Routine health data depends on how well surveillance is working, how much people use health services, and on errors caused by large groups of people moving.
Next steps: toward action research in public health
To test these ideas, this analysis sets up an action research project around one key question: Does adding 7-30 CHEF principles to existing surveillance systems help health zones detect disease faster and respond better when water and climate shocks happen?
Our working idea is that using local knowledge could cut the time between an alert and official detection. We will measure this in three ways: timing (how long between first signal and official detection, and between notification and investigation), quality (how many alerts turn out to be real, how reliable community signals are), and institutional learning (how many local practices get tested and kept going).
How this work builds on the 7-30 model and the Impact Accelerator
This analysis aims to shift how health security work, like the Impact Accelerator, approaches its goals. The question is no longer just whether the 7-30 model works (“Does 7-30 work?”). Instead we ask a practical question: What conditions help 7-30 CHEF principles turn frontline workers’ local knowledge into measured decisions within official systems? This shift takes us from abstract model to ground-level practice, from trial and error to testable idea, and from action to scientific measurement of how organizations learn.
How health security works together in the Democratic Republic of Congo
The setup we propose for the DRC does not add a new surveillance system on top of what already exists. Instead, it makes the systems we have work better together. Here is how the pieces fit:
| Component | What it does |
|---|---|
| Communities and local workers | Spot and record local warning signs |
| 7-30 CHEF framework | Understand the situation / decide what matters most / take first steps to protect people / learn and adjust |
| Official surveillance systems | Check the signals / report them / investigate |
| 7-1-7 target | Measure how long detection, reporting, and response take / find what slows things down |
| Multisector response | Connect health, water and sanitation, nutrition, protection, and food security |
| Feedback | Share what we learn and improve local and official practices |
The 7-1-7 measures timing across the whole system. It is not a step that comes before response.
Conclusion
Looking at what happened in Tanganyika province between 2018 and 2024 shows that floods are not just sudden emergencies. They multiply existing problems and create new ones. The crises in 2020, 2021, and 2024 prove that extreme weather reshapes everything that affects health. It damages water and sanitation systems. It threatens food and nutrition. It makes disease surveillance harder to do. The Democratic Republic of Congo’s health system can handle these complex challenges when it combines two strengths: the careful measurement that 7-1-7 provides with the local knowledge and hands-on learning that 7-30 CHEF brings.
About the author
Dr. Alexandre Alimasi Akili is a doctor, epidemiologist, and public health expert in the Democratic Republic of Congo. He has worked for more than twelve years in humanitarian settings, disease surveillance, and health emergency work.
He started his career in Congo’s public health system. He then worked with leading medical humanitarian groups including Doctors Without Borders, Première Urgence Internationale, and ALIMA in places facing complex crises, displaced populations, nutrition emergencies, and disease outbreaks. After that he joined the World Health Organization as an emergency epidemiologist in several DRC provinces, especially in Greater Katanga and Greater Kasai.
He works on surveillance and response to cholera, measles, and malaria outbreaks. He studies how humanitarian crises, environmental changes, and health system strength affect each other. He is interested in how the 7-30 and 7-1-7 models work together because he believes local knowledge should connect directly to official surveillance, decisions, and response systems. His approach combines practical public health work with research that leads to action.
References
- World Health Organization. Situation report: Cholera in the Democratic Republic of Congo. Geneva: WHO. 2023 [cited August 30, 2026].
- Resolve to Save Lives. The 7-1-7 Target: A global target for early disease detection and outbreak response. New York: RTSL. 2025 [cited August 30, 2026].
- World Health Organization. Early Action Reviews (EAR): Guidance for outbreak evaluation using timeliness metrics. Geneva: WHO. 2025 [cited August 30, 2026].
- International Organization for Migration (IOM). Displacement Tracking Matrix (DTM DRC): Emergency assessment alerts – Tanganyika Province, Moba Territory. Kinshasa: IOM DRC. 2024.
- FEWS NET. Democratic Republic of the Congo Remote Monitoring Report: Hydro-climatic shocks and agropastoral impacts in Tanganyika. Washington: FEWS NET. 2021.
- Frieden TR, Varma JK, McClelland A, et al. 7-1-7: an organizing principle, target, and accountability metric for regional and global health security. The Lancet. 2022;400(10364):1662-1664.
- The Geneva Learning Foundation. 7-30 Climate-Health Emergency Framework (CHEF): Field guide and operational manual for health systems resilience. Geneva: The Geneva Learning Foundation. 2026 [cited August 30, 2026].
- Sadki R. New certification: Climate-health emergency action framework (CHEF 7-30). The Public Health Blog. 2026 [cited August 30, 2026].
- Office for the Coordination of Humanitarian Affairs (OCHA). Democratic Republic of the Congo: Overview of humanitarian needs and impacts of flooding. Kinshasa: OCHA DRC. 2024.